James Bott wrote:Alvaro,
Sorry, no I never did. Most of my graphs are time series and TGraph works great for that. I can't remember what I did for the x,y plots that I needed back then, but I can find no evidence that I ever tried it. The TGraph code is quit complex and I expect it will take quite some time to modify it.
Regards,
James
Thank you James,
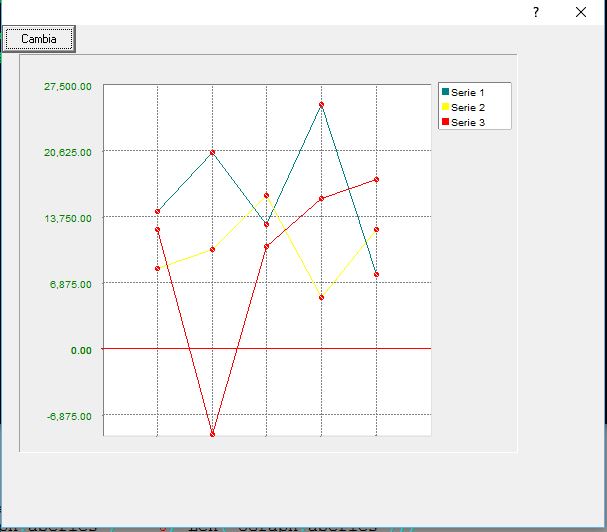
I modified the class yesterday to plot XY Charts.
New data:
#Define GRAPH_TYPE_XY_AQ 6

   data    chart_top
   data    chart_bottom
   data    chart_left
   data    chart_right
   DATA    nXMaxVal         // Max Value
   DATA    nXMinVal         // Min Value
   data    XY_Values
new methods
   METHOD  aq_DrawLine( nY, nX, nHigh, nWidth, nColor, lDotted  , nPenwidth )
   METHOD  aq_DrawPoint( nY, nX,  nColor, lDotted , nPixels  , nPenwidth )

// --------------------------------------------------------------------------- //
METHOD aq_DrawLine( nY1, nX1, nY2, nX2, nColor, lDotted , nPenwidth) CLASS TGraph
local x1,x2,y1,y2
local era_nPenwidth

default nPenwidth := 3

era_nPenwidth := ::nPenwidth
::nPenWidth :=  nPenwidth


x1 := ::chart_left +   (nX1-::nXMinVal ) / (::nXMaxval-::nXMinVal) * ( ::chart_right - ::chart_left )
y1 := ::chart_bottom - (nY1-::nMinVal) / (::nMaxval-::nMinVal) * ( ::chart_bottom - ::chart_top )
x2 := ::chart_left +   (nX2-::nXMinVal ) / (::nXMaxval-::nXMinVal) * ( ::chart_right - ::chart_left )
y2 := ::chart_bottom - (nY2-::nMinVal) / (::nMaxval-::nMinVal) * ( ::chart_bottom - ::chart_top )

::DrawLine( y1, x1, y2, x2, nColor, lDotted )

::nPenWidth := era_nPenwidth

return nil
// --------------------------------------------------------------------------- //
METHOD aq_DrawPoint( nY1, nX1, nColor, lDotted , npixels  , nPenwidth ) CLASS TGraph
local x1,y1
local era_nPenwidth


default nPenwidth := nPenwidth
default nPixels := 7

era_nPenwidth := ::nPenwidth
::nPenWidth := 4


nPixels := nPixels /2

x1 := ::chart_left +   (nX1-::nXMinVal ) / (::nXMaxval-::nXMinVal) * ( ::chart_right - ::chart_left )
y1 := ::chart_bottom - (nY1-::nMinVal) / (::nMaxval-::nMinVal) * ( ::chart_bottom - ::chart_top )

::DrawLine( y1 , x1-nPixels , y1+nPixels, x1, nColor, lDotted )
::DrawLine( y1+nPixels , x1 , y1, x1+nPixels, nColor, lDotted )
::DrawLine( y1 , x1+nPixels , y1-nPixels, x1, nColor, lDotted )
::DrawLine( y1-nPixels , x1 , y1 , x1-nPixels , nColor, lDotted )

::nPenWidth := era_nPenwidth

return nil
This line at the begining of method new and method redefine
This lines in the Paint method after the tag // Graph borders
::chart_top := nTop
::chart_bottom := nBottom
::chart_left := nLeft
::chart_right := nRight
And finally this lines in the Paint method before the tag // legends or // Max, Min values
   IF ::nType == GRAPH_TYPE_XY_AQ
      FOR nJ := 1 TO Len( ::aSeries )
         for nI := 1 to len( ::XY_Values[nJ] ) -1
          ::aq_Drawline( ::XY_Values[nJ, nI,2] , ::XY_Values[nJ,nI,1] , ;
                           ::XY_Values[nJ, nI+1,2] , ::XY_Values[nJ, nI+1,1], ::aSeries[nj,2] )
         next nI

         if len( ::XY_Values[nJ] ) == 1
            ::aq_DrawPoint( ::XY_Values[nJ, 1,2] , ::XY_Values[nJ,1,1] , ::aSeries[nj,2] ,,  )
         endif
      next nJ
      if ::lYVal
            ::Say( 325 , 80 , "Hola" , ::aFont[3], rgb(0,0,0) , ::nTLeft )
      endif
   endif
Then in your prg code you have to put
   oChart:nType    := GRAPH_TYPE_XY_AQ

 oChart:nMaxVal   := max_value //  your calculated max value for Y axis
 oChart:nMinVal   := min_value  //  your calculated min value for Y axis
 oChart:nXMaxVal  := max_Xvalue  //  your calculated max value for X axis
 oChart:nXMinVal  := min_Xvalue    //  your calculated min value for X axis

 oChart:AddSerie(  {} , "name_or_the_serie1" , RGB(128,128,255) )  // empty array
 aadd( oChart:XY_Values , aArray1  )  // aArray1 is an array with the XY points  i.e. {   { 1.25 , 9.25} , { 1.5  , 9.452 } , ......}

 oChart:AddSerie(  {} , "name_or_the_serie2" , RGB(128,128,255) )  // empty array
 aadd( oChart:XY_Values , aArray2  )  // aArray2 is an array with the XY points  i.e. {   { 3.25 , 7.25} , { 2.5  , 8.452 } , ......}

you may add more series
Regards