Easily ? depends on your skilss of Java, html and Css, but I agree, seeing this there is a potential use for it (in my case this program)
As you try, My controls of FW are froozen or the html code is keeping buzy because I can't click or even select the program.
I run it from samples folder, so background etc should work.
the Eval(Java) code.... Can you show it here ? data is in xbrowse. When running it would make a good sample for the samples folder.
and the setting of background from the HTML of FWH into transparent in case of a jpg like the first post.
#include "FiveWin.ch"
#Define CLR_ORANGE nRGB( 255, 165, 000 )
function Main()
local oDlg, oWebView, oBrush, oWnd, oMain
local aData, oBtn1
//DEFINE BRUSH oBrush FILE "arduino2.jpg" RESIZE
DEFINE BRUSH oBrush FILE "..\bitmaps\backgrnd\iosbg.bmp" RESIZE
//DEFINE BRUSH oBrush COLOR RGB( 77, 99, 110 )
DEFINE DIALOG oDlg WINDOW oMain SIZE 1400,900 PIXEL TRUEPIXEL TITLE "Google charts" BRUSH oBrush
// These says are done because I don't find the transparant clause for the gauges yet.
//
They simple make a region transparent
@ 1, 1 SAY " " OF oDlg SIZE 1400, 380 PIXEL COLORS CLR_ORANGE, CLR_WHITE TRANSPARENT UPDATE
@ 380, 1 SAY " " OF oDlg SIZE 470, 520 PIXEL COLORS CLR_ORANGE, CLR_WHITE TRANSPARENT UPDATE
@ 380, 950 SAY " " OF oDlg SIZE 700, 520 PIXEL COLORS CLR_ORANGE, CLR_WHITE TRANSPARENT UPDATE
@ 520, 1 SAY " " OF oDlg SIZE 1400, 900 PIXEL COLORS CLR_ORANGE, CLR_WHITE TRANSPARENT UPDATE
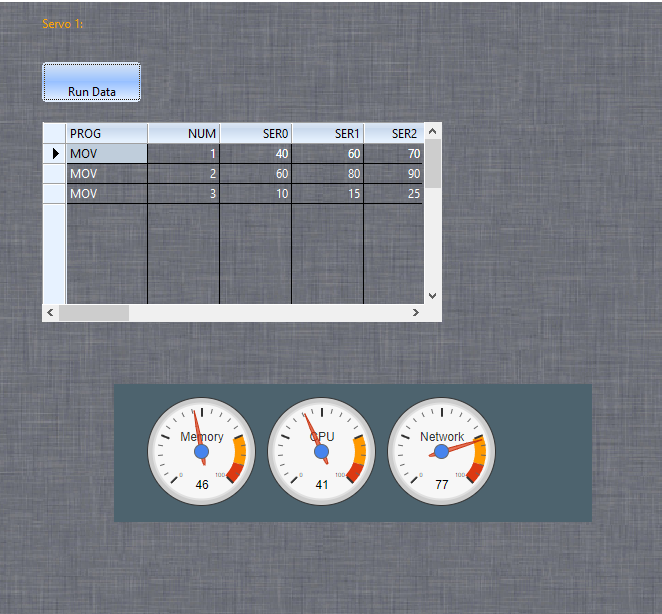
@ 15, 400 SAY "&Servo 1:" OF oDlg SIZE 100, 25 PIXEL COLORS CLR_ORANGE, CLR_WHITE TRANSPARENT UPDATE
@ 60, 400 BTNBMP oBtn1 OF oDlg SIZE 100, 40 NOBORDER PROMPT "Run Data" 2007 ACTION rundata(oDlg)
RunXBrowser(oDlg)
ACTIVATE DIALOG oDlg CENTERED ;
ON INIT ( oWebView := TWebView():New(, oDlg:hWnd ), oWebView:SetSize( 1400, 900 ),;
oWebView:SetHtml( Html() ) ) ;
VALID ( oWebView:Terminate(), oWebView:Destroy(), .T. )
return nil
function Html()
local cHtml
TEXT INTO cHtml
<html>
<head>
<style>
body {
display: flex;
align-items: center;
justify-content: center;
height: 100vh;
background-color: #004e5766;
font-family: Arial, sans-serif;
margin: 0;
padding: 0;
}
.container {
max-width: 400px;
margin: 0 auto;
padding: 40px;
background-color: #FFFFFF; //00FFFFFF is not transparent
border-radius: 5px;
display: flex;
flex-direction: column;
align-items: center;
box-shadow: 0px 0px 44px rgba(0, 0, 0, 0.7) !important;
overflow:none !important;
}
body {
background-color: #4d636e;
}
</style>
<script type="text/javascript" src="https://www.gstatic.com/charts/loader.js"></script>
<script type="text/javascript">
google.charts.load('current', {'packages':['gauge']});
google.charts.setOnLoadCallback(drawChart);
function drawChart() {
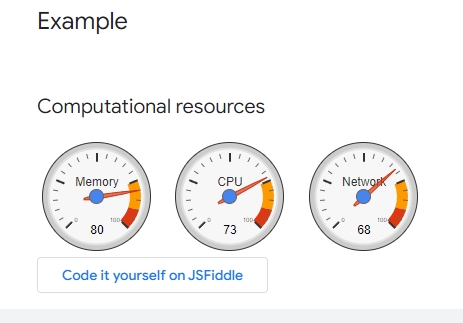
var data = google.visualization.arrayToDataTable([
['Label', 'Value'],
['Memory', 80],
['CPU', 55],
['Network', 68]
]);
var options = {
width: 400, height: 120,
redFrom: 90, redTo: 100,
yellowFrom:75, yellowTo: 90,
minorTicks: 5
};
var chart = new google.visualization.Gauge(document.getElementById('chart_div'));
chart.draw(data, options);
setInterval(function() {
data.setValue(0, 1, 40 + Math.round(60 * Math.random()));
chart.draw(data, options);
}, 1000);
setInterval(function() {
data.setValue(1, 1, 40 + Math.round(60 * Math.random()));
chart.draw(data, options);
}, 2000);
setInterval(function() {
data.setValue(2, 1, 60 + Math.round(20 * Math.random()));
chart.draw(data, options);
}, 2500);
}
</script>
</head>
<body background="c:\fwharb\samples\arduino2.jpg">
<div id="chart_div" style="width: 400px; height: 120px;"></div>
</body>
</html>
ENDTEXT
return cHtml
function runXbrowser(oDlg)
local oFont, oBrw, oData, oBrushBrw
DBCREATE( "TEST", { { "PROG", "C", 7, 0 } ;
, { "Num", "N", 5, 0 } ;
, { "SER0", "N", 5, 0 } ;
, { "SER1", "N", 5, 0 } ;
, { "SER2", "N", 5, 0 } ;
}, "DBFCDX", .T., "TST" )
FW_ArrayToDBF( { { "MOV",1,40,60,70 }, { "MOV",2,60,80,90 }, { "MOV",3,10,15,25 } } )
CLOSE TST
// Created
DEFINE BRUSH oBrushBrw COLOR RGB( 192, 192, 192 )
USE TEST SHARED NEW
DEFINE FONT oFont NAME "TAHOMA" SIZE 0,-14
@ 120,400 XBROWSE oBrw SIZE 400,200 PIXEL OF oDlg ;
DATASOURCE "TEST" COLUMNS "PROG", "NUM", "SER0", "SER1", "SER2" ;
HEADERS nil, nil, nil, nil, nil ;
COLSIZES 80, 70, 70, 70, 70 ;
CELL LINES NOBORDER TRANSPARENT
WITH OBJECT oBrw
:nStretchCol := 1
:nRowHeight := 20
:CreateFromCode()
END
WITH object oBrw:aCols[3]
:nEditType := EDIT_GET
:cEditPicture := "999"
:lAutoSave := .T.
end
return nil
function rundata(oDlg)
msginfo("I hope Mr. Antonio will be so kind to show the code to update the Xbrowse data and show them in the 3 gauges")
return NIL